

Spectroscopy for Energy & Environmental Industries
Ocean Optics provides real-time spectral solutions for researchers and businesses addressing the world’s increasing energy demands, including tools for mining and exploration, development of renewable resources, and monitoring of energy production.
Use Ocean Optics for …

Fuel Clarity and Quality Testing

Mining Exploration


Renewable Energy Research
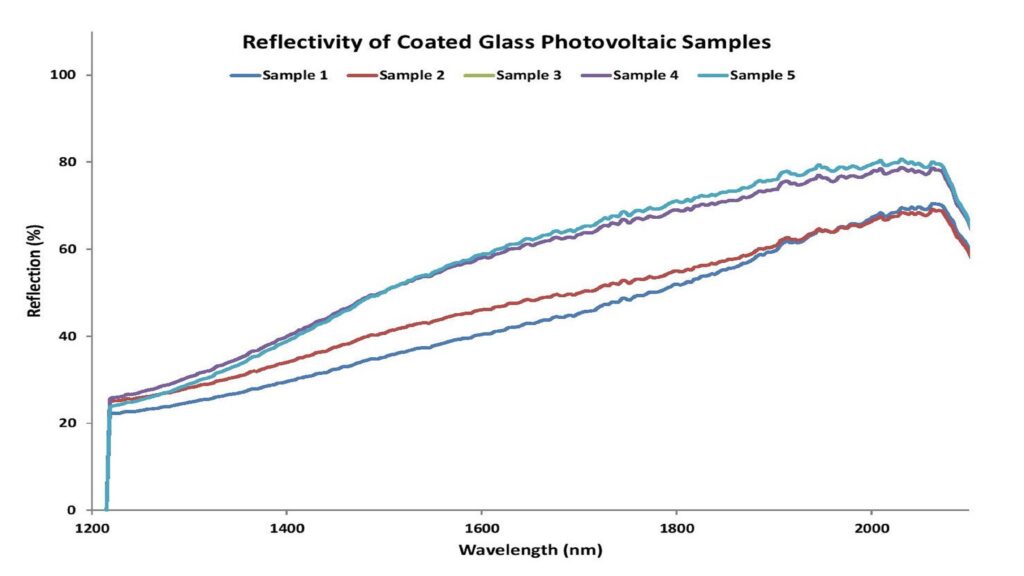
Spectroscopy Techniques: Photovoltaics Materials Analysis
Spectroscopy techniques were used to analyze the reflectivity of proprietary coated glass samples for thin film photovoltaic panels, conducted within a range of 1200-2100 nm under ambient lab conditions. Our spectrometers evaluate reflectivity aids in understanding light loss areas in photovoltaic panels, crucial for enhancing energy conversion efficiency through materials like anti-reflective coatings and glass dopants.
Ocean Optics provides multiple spectrometer types designed to meet the needs of energy industry partners.
| Spectrometers to Improve Quality and Increase ROI | ||||
| SR Series Spectrometers | HR Series Spectrometers | |||
| Key features: | Rapid acquisition speed, great versatility, UV response | High resolution, great thermal stability, NIR response | ||
| Example techniques: | Absorbance, Fluorescence | Absorbance, Irradiance, Reflectance | ||
| Example energy applications: | Crude oil analysis, remote sensing in mineral exploration | Chemical composition analysis, solar simulator testing | ||